
Most marketers assume a low funnel conversion rate is a design problem. Fix the button color, shorten the form, rewrite the headline. But the real answer is rarely that simple. Understanding what is funnel conversion rate, and what it actually tells you about your business, is the difference between guessing and growing. This guide breaks down the formula, the benchmarks, the myths that waste your time, and the strategies that actually move the number.
Table of Contents
- Key takeaways
- What is funnel conversion rate and how to calculate it
- Typical funnel stages and average conversion benchmarks
- Common misconceptions about funnel conversion rates
- Practical strategies to improve funnel conversions
- How to monitor and continuously improve your funnel
- My take on what actually moves funnel conversion rates
- Ready to take your funnel further?
- FAQ
Key takeaways
| Point | Details |
|---|---|
| Know the formula | Funnel conversion rate = conversions divided by entries, multiplied by 100. |
| Track each stage separately | Overall rate hides weak spots; stage-by-stage data reveals where leads actually drop. |
| Benchmarks vary by stage | B2B funnels average 25–35% lead to MQL, but only 15–30% opportunity to close. |
| Targeting beats friction fixes | Wrong audience kills conversion faster than a poor CTA or a clunky form layout. |
| Fix the worst stage first | Fixing your single worst-performing stage creates the largest compound revenue gain. |
What is funnel conversion rate and how to calculate it
At its core, funnel conversion rate is the percentage of users who complete a defined multi-step process relative to the total number who entered it. The formula is simple: divide completions by entries, then multiply by 100.
Say 1,000 people enter your funnel and 50 buy. Your funnel conversion rate is 5%. That number looks straightforward, but here is where most marketers go wrong: they treat it as a single verdict on their whole funnel when it is really a weighted average hiding multiple problems.
The smarter move is to calculate conversion rates at every stage, not just from entry to exit. Here is the standard sequence:
- Calculate the entry-to-stage-2 conversion rate (e.g., how many visitors become leads)
- Calculate the stage-2-to-stage-3 rate (e.g., how many leads become marketing qualified leads)
- Continue down every stage to the final conversion
- Multiply all individual stage rates together to get your overall rate
That last step matters more than most people realize. The overall funnel rate is the product of every individual stage rate, meaning that improving even one stage proportionally lifts your total. A 10% improvement at a stage converting at 20% can produce a bigger revenue swing than a 50% improvement at a stage that already converts well.
One technical issue worth knowing: do not measure your funnel conversion rate as a snapshot in time. Users move through funnels at different speeds, so a snapshot count can make your rate look artificially low or high. Cohort-based tracking groups users by the date they entered the funnel, giving you a clean, comparable read on how each cohort actually performed.
Pro Tip: Set up your analytics to track cohorts from first touch, not calendar month, so you can compare apples to apples when reviewing monthly performance.
For a practical walkthrough on building the stages themselves, the funnel creation guide at Moneyfunnel covers the architecture in detail.
Typical funnel stages and average conversion benchmarks
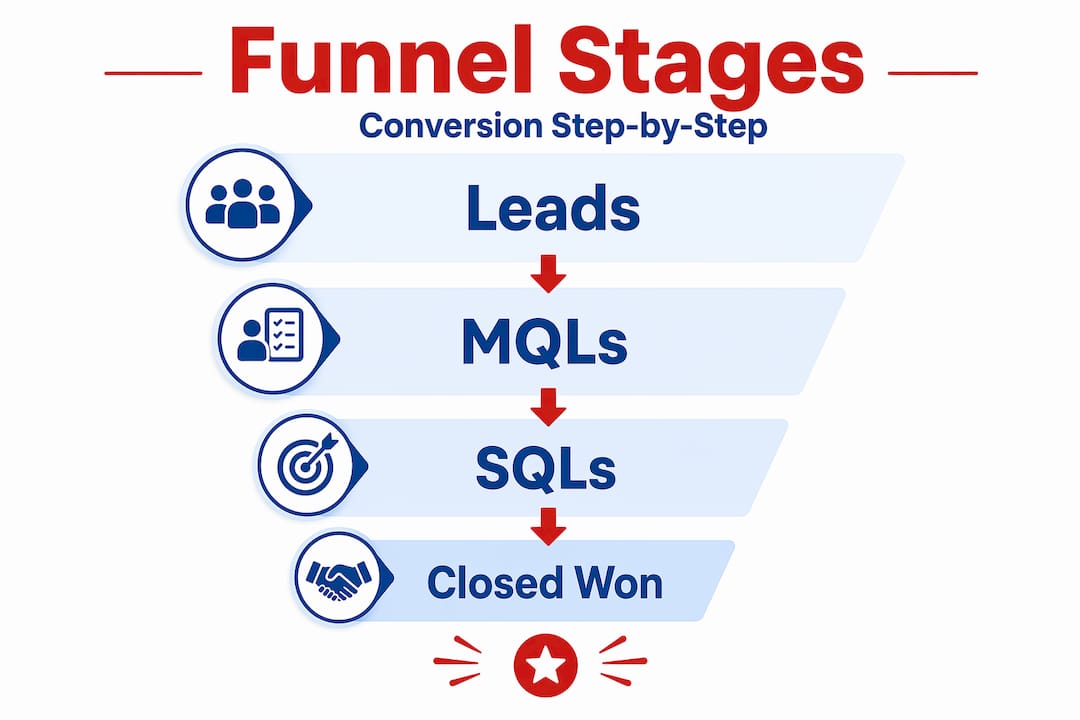
Most B2B and direct-response funnels share a common backbone of stages. Understanding where a prospect sits at each point helps you apply the right funnel tracking and set realistic performance targets.

Here are the five core stages and their mid-2020s B2B conversion benchmarks:
| Stage | Conversion Range | What it measures |
|---|---|---|
| Lead to MQL | 25–35% | Traffic that qualifies as a real prospect |
| MQL to SQL | 13–26% | Marketing-qualified leads accepted by sales |
| SQL to opportunity | 50–62% | Qualified deals entering active pipeline |
| Opportunity to close | 15–30% | Deals that result in actual revenue |
| Overall funnel | 1–5% | Total entries that become paying customers |
A few things stand out in that table. The SQL-to-opportunity jump looks impressive at 50 to 62%, but notice how hard the bottom of the funnel is. Only 15 to 30% of opportunities actually close. That is where most revenue is lost, and most teams underinvest their attention there.
Benchmarks are useful for a few specific reasons:
- They tell you whether your funnel is healthy relative to your industry, not just relative to last month
- They reveal which stage is genuinely underperforming versus which is operating normally
- They give you a baseline before testing changes, so you can measure real lift
Keep in mind that these ranges shift significantly by industry. SaaS funnels, e-commerce funnels, and high-ticket coaching funnels all perform differently. A 2% overall conversion rate in B2B enterprise sales can be exceptional. The same number in e-commerce is a problem. Context matters when you are interpreting where your funnel sits. To get a fuller picture of how funnel architecture drives these numbers, the marketing funnel guide at Moneyfunnel is worth reading alongside this data.
Common misconceptions about funnel conversion rates
The most costly myth in funnel optimization is this: low conversion rates are a friction problem. Marketers spend weeks redesigning checkout flows and tweaking button copy when the real issue is that they attracted the wrong people in the first place.
A low conversion rate often signals a targeting problem, not a technical one. A flawless funnel filled with unqualified traffic will always underperform. When someone has no genuine need for what you offer, no amount of UX polish will close them.
"Optimizing cheap traffic does not improve conversion rates. It corrupts your data and obscures the real problem: you are talking to the wrong audience."
There is a useful distinction here between system quality and fit quality. System quality covers the technical side: load speed, form length, CTA clarity, page flow. Fit quality is about whether the person entering your funnel is actually a buyer. Most optimization efforts obsess over system quality while ignoring fit quality entirely. That is backwards when your traffic source is the real bottleneck.
Another misconception is that you should run multivariate tests to find what works faster. On most business funnels with moderate traffic, multivariate testing produces statistically insignificant results. You end up chasing noise. A simple A/B test with one variable, run long enough to reach significance, teaches you far more and costs fewer conversions in the learning phase.
Pro Tip: Before testing anything on your funnel, check whether your traffic source has changed recently. A new ad campaign targeting broader audiences can tank your conversion rate faster than any page element ever could.
Practical strategies to improve funnel conversions
Once you understand the mechanics and the common traps, the path to better conversions becomes concrete. Here are the highest-impact tactics, organized by the order in which you should address them.
Start by identifying the single stage with the largest drop-off. Fixing your worst-performing stage exclusively creates outsized revenue gains because of the compound effect across the rest of the funnel. Do not spread attention across every stage at once.
From there, work through these in order:
- Speed up your follow-up. 75% of prospects expect rapid response, and responding within the first minute can increase conversions by close to 400%. Slow follow-up is a silent conversion killer that does not show up on your page analytics.
- Audit your CTAs. Weak CTAs like "see pricing" reduce conversions significantly. Value-driven CTAs placed next to minimal form fields perform best because they reduce the perceived cost of taking action while reinforcing the benefit.
- Use heatmaps and session recordings before A/B testing. Tools that show where users click, scroll, and stop give you a diagnosis before you start testing treatments. Testing without diagnosis is expensive guessing.
- Simplify your forms. Every extra field you add reduces completion rates. Ask only for what you need at that stage. You can collect more information later.
- Present one choice per step. High-converting funnels remove distractions and give prospects a single decision at each stage, maintaining a curiosity loop that keeps them moving forward.
Also consider funnel automation for your follow-up sequences. Automated email and SMS sequences triggered by behavior, not just time, let you respond fast at scale without a large sales team.
How to monitor and continuously improve your funnel
Optimization is not a one-time project. It is a system. The marketers who consistently improve their funnel conversion rate are the ones who have built a repeatable process for measurement and iteration.
Here is a comparison of a reactive approach versus a structured optimization cycle:
| Approach | Reactive | Structured |
|---|---|---|
| Trigger for action | Something breaks or drops | Scheduled review cadence |
| Data used | Surface metrics (overall rate) | Stage-by-stage, device, traffic source |
| Testing method | Ad hoc changes | Single-variable A/B tests with defined endpoints |
| Feedback source | Internal assumption | Buyer interviews and session recordings |
| Outcome | Random improvements | Compounding gains over time |
The structured approach requires a few habits. Set a weekly or biweekly review where you look at funnel metrics by stage, segment by device type and traffic source, and flag any stage that dropped more than 5% from the prior period. Segment by device because mobile and desktop users often behave very differently at the same funnel step.
Beyond the data, collect direct buyer feedback. Ask customers what nearly stopped them from buying. Their answers will surface objections your analytics cannot show. That insight feeds your next round of copy and CTA tests, closing the loop between what the numbers say and what buyers actually feel. For a deeper look at using competitor funnel data to inform your own improvements, the article on funnel hacking at Moneyfunnel is a practical read.
My take on what actually moves funnel conversion rates
I have spent years looking at funnels that should work on paper but do not, and funnels that look rough but consistently outperform. The pattern I keep seeing is this: the teams obsessed with their metrics are not always the ones with the best results. The teams obsessed with their buyers almost always are.
In my experience, when I dig into a funnel with a stubborn conversion problem, the answer is rarely on the page. It is upstream, in the audience selection, the ad targeting, or the organic content that is pulling in the wrong people. Fixing that one thing can double a conversion rate without touching a single page element.
I have also learned to focus relentlessly on the worst stage. Not the average. Not the overall number. The single worst-performing transition in the funnel. When you pour your energy into that one point, the compound math takes over and the overall rate moves in ways that feel disproportionate to the effort.
The most counterintuitive thing I would tell any marketer: your gut still matters. Data tells you what is happening. It rarely tells you why. Buyer interviews, even informal ones, will hand you insights that months of testing might never surface. Use the data to prioritize where to look, then use empathy to understand what you find.
— Mike
Ready to take your funnel further?
If this article gave you clarity on funnel conversion rate theory, the next step is applying it with expert guidance behind you.

Moneyfunnel's 6-Day Mentorship Program gives you a structured, hands-on path through funnel design, conversion optimization, and traffic strategy. Rather than piecing together tactics from scattered sources, you work through a proven framework with direct mentorship. The program is built for marketers and business owners who want to go from understanding funnels to running one that consistently converts. Spots are limited, so if you are serious about funnel mastery, this is where you start.
FAQ
What is funnel conversion rate in simple terms?
Funnel conversion rate is the percentage of people who enter a multi-step process and complete the final desired action. It is calculated by dividing total conversions by total entries, then multiplying by 100.
What is a good funnel conversion rate?
A good rate depends on your industry and funnel type. Most B2B funnels see an overall conversion rate between 1% and 5%, while individual stages like SQL to opportunity can convert at 50 to 62%.
How do you increase funnel conversion rates quickly?
Identify your single worst-performing stage and focus all testing there first. Faster follow-up, stronger CTAs, and simplified forms at that stage will produce the fastest measurable lift.
Why does high traffic not always mean higher conversions?
High traffic with low conversion usually points to a targeting problem, not a page problem. Attracting the wrong audience means even a technically sound funnel will underperform because the visitors have no real intent to buy.
How often should you track funnel metrics?
Review stage-by-stage funnel metrics at least biweekly. Segment by traffic source and device type, and use cohort-based tracking rather than snapshot data to get accurate, comparable results over time.